- Elsinore Valley Municipal Water District -

EVMWD Condition Assessment of Motor Control Centers and Pump Control Panels

Condition Assessment

Author: Michael Assadourian, P.E.

HERO lake-elsinore_cropped_tinified


1. MAP


Project Description
Elsinore Valley Municipal Water District (District) is a publicly owned water and sewer service agency with approximately 44,000 water service and 35,000 sewer service connections, serving a population of approximately 145,000. The District operates 129 facilities, including 54 booster stations, 38 lift stations, 27 well sites, 5 recycled water pump stations, 3 wastewater treatment plants, and 2 water treatment plants.

2. IMG_4624_cropped_tinified


Background

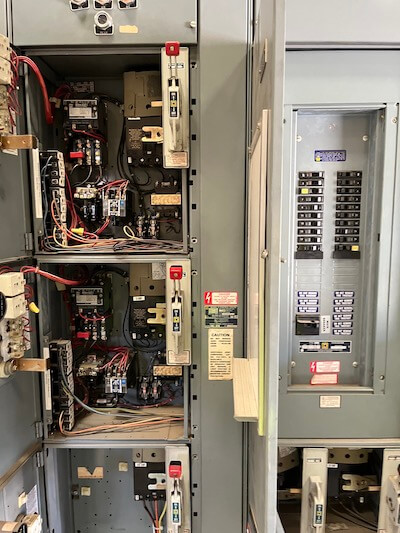
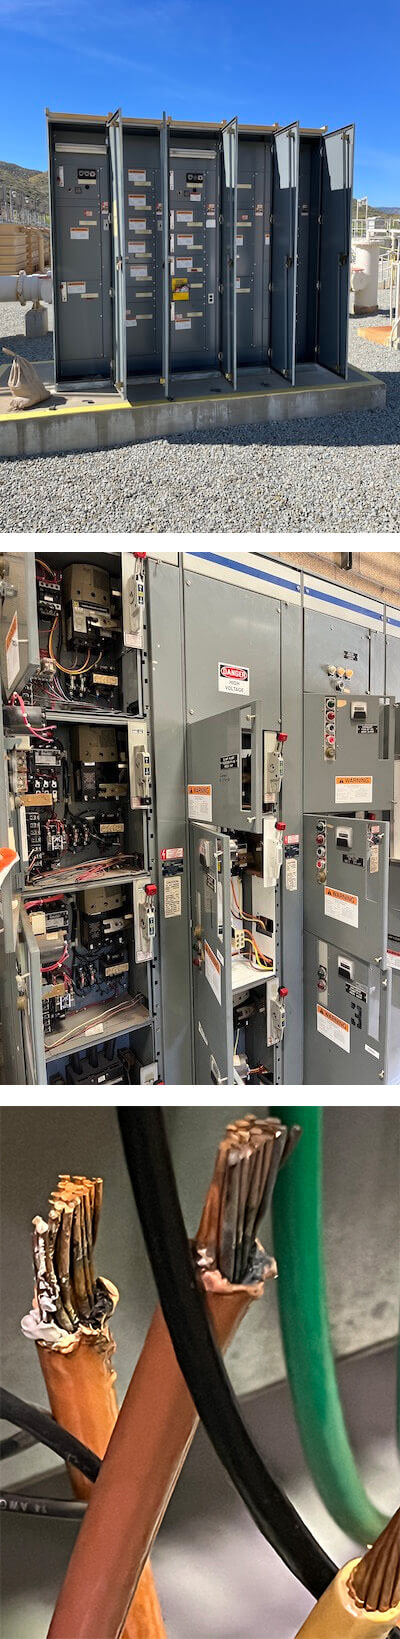
Original construction dates for these facilities range from the early 1970s to 2016, with a few of the older facilities having various rehabilitation improvements projects completed around 2004. Due to the general age of the equipment, some of the Motor Control Centers (MCCs) and Pump Control Panels (PCP) have become difficult to maintain because replacement parts are difficult to find and have the potential to impact reliable operations.

For these reasons, the District‘s Engineering Department initiated the MCCs and PCP Condition Assessment Project and contracted LEE + RO to evaluate the condition of existing motor control equipment within 116 of these facilities located within the District boundaries and within the City of Lake Elsinore.

The main goal is to develop a prioritized list of the Capital Improvement Projects (CIP)s to rehabilitate these facilities.

3. IMG_4427_cropped_tinified


Challenges

Besides time and schedule constraints, other challenges facing this project were the large number of facilities to be inspected and tested, and the substantial District region, roughly 40 miles long and 22 miles wide, within which these facilities are scattered. The 116 facilities located within the District boundaries includes:

  • 107 facilities within the City of Lake Elsinore in a span of roughly 22 miles along Interstate 15 (I-15) and 13 miles along California State Route 74 (SR-74).
  • 5 facilities within the City of Corona along I-15 south of California State Route 91 (SR-91).
  • 4 facilities within the City of San Bernardino at the junction of Interstate10 (I-10) and Interstate 215 (I-215).

4. IMG_4343_v3_cropped_tinified

Solution
DATA COLLECTION AND REVIEW

LEE + RO provided professional engineering services for scheduling meetings and coordinating site visits with District staff to allow for visual inspection and evaluation of the 116 facilities. A kick-off meeting was conducted to brainstorm ideas and identify project constraints. To meet the time and schedule constraints LEE + RO:

  1. Hired two (2) subcontractors to perform the MCC and PCP inspections and testing concurrently, effectively halving the amount of time required if only one subcontractor has been used in the field.
  2. Utilized the District’s facilities map to establish a geographic sequential numbering of the sites. This way, any group or cluster of sequentially numbered sites selected for inspection or testing would be located within very close proximity (i.e. 3 – 4 miles), thus minimizing travel time and delays between sites.
  3. Developed a field inspection checklist for each facility to collect and analyze documents such as as-built drawings, one-line diagrams, short circuit, coordination and Arc Flash system studies, past investigation reports, and maintenance/repair logs. One-line diagrams, if available, were verified with the existing installation, and any discrepancies were provided to the District as a drawing markup. For facilities where one-line diagrams were not available, LEE + RO collected the necessary data through field visits and generated a new detailed one-line diagram. All existing, revised, and new one-line diagrams now indicate the actual electrical structures, voltages, available short circuit at the MCC, horsepower rating of each motor, and names of all panels and equipment.
  4. To ensure consistent and uniform MCC and PCP testing of all the 116 facilities by the two subcontractors, LEE + RO developed testing checklists to ensure that all testing procedures were followed based on the District’s requirements. The condition assessment testing by the subcontractors included:
    1. Test current draw on motors - Use clamp-on ammeter to measure each motor’s amperage while running, document and provide with report for each site.
    2. Check grounds - Visual and mechanical inspection from the MCC to source and to major loads. Inspect anchorage. Electrical testing, perform point‐to‐point tests to determine the resistance between the main grounding system and all major electrical equipment frames, system neutral, and/or derived neutral points. Document and provide with report for each site.
    3. Megger the pump motor - Electrical test, perform insulation resistance test in accordance with IEEE 43, testing from the MCC bucket at each location to the motor. Calculate polarization index. Machines less than or equal to 200 HP: test duration shall be 1 minute. Calculate the dielectric‐absorption ratio. Document and provide with report for each site.
    4. Check the age of all breakers and determine if they are still available for purchase. Document and provide with report for each site.
    5. Infrared (Thermographic Scanning) Report at MCC and PCPs. Visual and Mechanical Inspection- Inspect physical and mechanical condition. Remove panel covers or view the equipment through the viewing ports designed to transmit applicable signals being measured. Document and provide survey with the report for each site, including temperature, discrepancies, areas inspected, identify loads, identify areas of concern, and provide recommendations actions for repair.
    6. Rodent Abatement Measures/Recommendations - Document and provide with report for each site, rodent issues, and recommendations for remediation.
    7. Cleaning of MCC/PCP - Provide general light cleaning (brush down) of MCC and PCP. If deemed safe, vacuum and brush inside of control panel. If deemed safe, brush inside MCC cans. This was very time dependent and based on the duration of outage and was limited per the District’s request for scope/cost reduction measures.

Site Condition Assessment Report-General

Site Condition Assessment Report
General

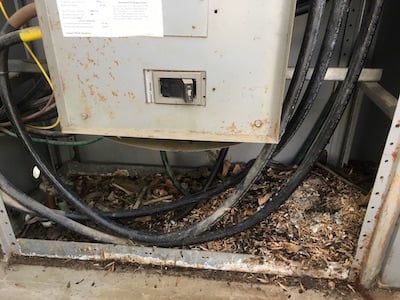
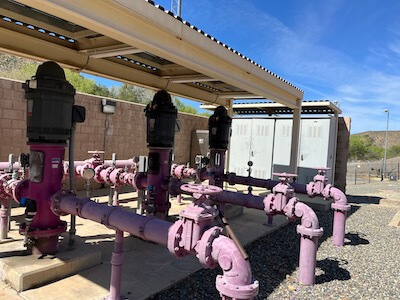
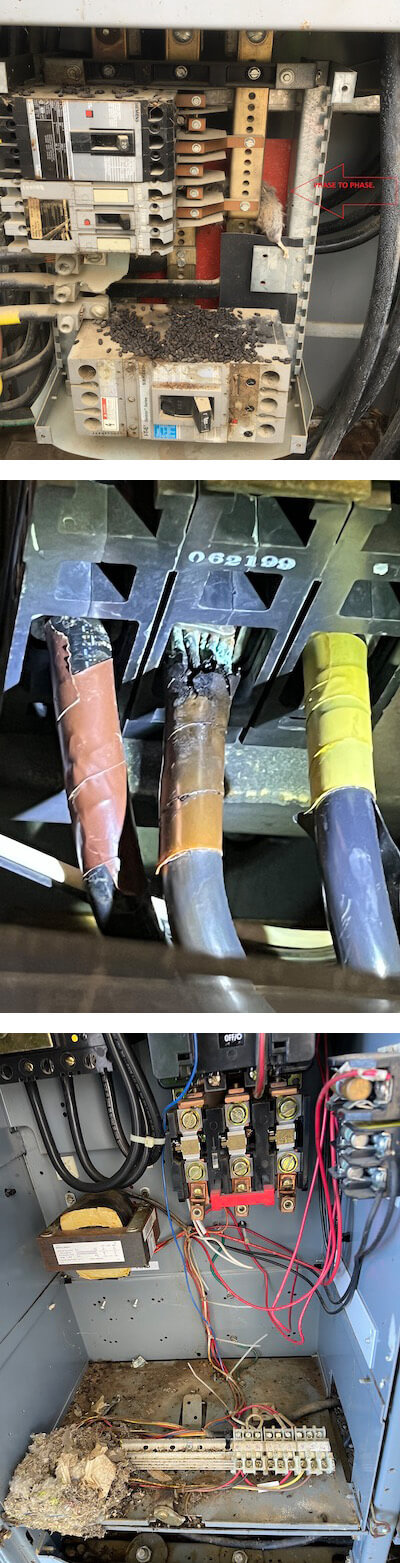
A site condition assessment was performed at each of the 116 facilities and treatment plants in the City of Elsinore. Site assessments were conducted in conjunction with the testing of the MCCs and PCPs. Detailed photos were taken and organized into a photo set for each of the facilities and included as part of the condition assessment as a separate booklet.


Methodology 1-3 tinified


Site Condition Assessment Report
Methodology

LEE + RO provided a draft and a final copy of the Condition Assessment Report for the District to review. The Report included the following:

  1. Field investigation results
  2. Site issues
  3. Recommended upgrades and repairs
  4. Planning level costs for each recommended repair or improvement
  5. Prioritization of the recommended improvements
  6. Remaining useful life of the site if repairs and upgrades are performed.

The assessment of the District’s Pump Stations was reviewed within three general categories, the Likelihood of Failure (LOF), the Consequence of Failure (COF), and the Risk of Failure. A value scale between 1 to 10 was used to score the LOF and the COF, with 1 as the lowest score and 10 as the highest score. After the values for the LOF and COF were assigned, the Risk of Failure was calculated to determine critical improvements that may require immediate review or mild improvements that could be temporarily delayed in favor of more critical improvements. The Risk of Failure is the overall value of each assessment made. The risk of failure is the product of the LOF and COF.

LOF * COF = Risk of Failure

A high-risk value recommends that this assessment should be reviewed and considered for improvements in the near future. A low-risk value recommends that this assessment could be delayed for improvements in favor for higher risk items. However, a low risk assessment should still be part of daily maintenance and inspections in case of unforeseen events that may progress to a higher risk value.

Based on the analysis and condition assessment, a list of prioritized capital improvement projects (CIP) was developed for all facilities. Project priority was scored based on likelihood and consequence of failure and criticality of the facility.

Lf * Cf * N = P

Lf = Likelihood of Failure (1 – 10, where 10 = most likely)

Cf = Consequence of Failure (1-10, based on various impacts, e.g. unsafe operating condition = 10, etc.)

N = Criticality coefficient (0.0-1.0, with higher scores assigned to the most critical facilities, e.g. older non-renovated)

P = Priority Score (0.0-100, with 100 being the highest priority)


Results

Each facility was assessed electrically in accordance with the test and condition categories listed in the data collection above, and each facility was assigned a total priority score. CIP project sheets were developed for each facility providing necessary information including condition-based defects, recommended project, value added standardization of the facilities, and preliminary cost estimates.


More Solutions

Download the Case Study